Profiting from Pollution
PDF DownloadThis Article presents original results from a large-scale study of environmental violations. I use the universe of civil Clean Air Act environmental violations by stationary emitters of pollution to test the effectiveness of EPA enforcement. Using conservative assumptions, I find that in 36% of cases, it is profitable for firms to violate the Clean Air Act, even after paying fines. Importantly, the profitability of noncompliance is increasing in the size of the violation, such that almost every large violation of the Clean Air Act is profitable. In aggregate, I estimate that penalties imposed by the EPA would have to be four times greater than those imposed to achieve the EPA’s stated policy goal of removing the economic benefits of noncompliance. In every case of profitable noncompliance, the EPA had statutory authority to impose a larger penalty, and official EPA policies called for a larger penalty. I further find that the most profitable violations are also the most harmful to the environment in terms of net emissions. My study suggests that some firms have little financial incentive to comply with the Clean Air Act and suggests that if the EPA were to comply with its own policies, this effect would be mitigated.
Introduction
Climate change threatens everyone, everywhere. Wildfires, droughts, and floods threaten lives and livelihoods across the United States and around the world. These growing costs of climate change help explain the uproar in response to the Supreme Court’s 2022 ruling in West Virginia v. Environmental Protection Agency (WV v. EPA).11.142 S. Ct. 2587 (2022). The Court rejected an expansive reading of Section 7411 of the Clean Air Act, which limited the powers of the EPA to require emitters to take actions to reduce greenhouse gas (GHG) emissions. Many now believe that the EPA’s ability to help in the fight against climate change has been fundamentally curtailed.
While the decision has limited the powers of the EPA, it might not have the effect that many advocates and commentators fear. That is, the curtailed powers matter only to the extent that the EPA would have used those powers to effectively limit emissions and penalize violators in the first place. That is, given the power to regulate emissions and penalize violations, will the EPA do so effectively? Using empirical evidence from hundreds of emissions violations spanning decades, this Article answers “No.”
To effectively regulate emissions, the EPA needs to do two things. It needs to set standards, and it needs to effectively punish noncompliance with those standards. To the extent that firms do break the law, the EPA is tasked with imposing fines on those firms. Indeed, under the Clean Air Act, the central goal of imposing penalties is to ensure that “any penalty should, at a minimum, remove any significant economic benefits resulting from noncompliance.”22.U.S. Env’t Prot. Agency, Clean Air Act: Stationary Source Civil Penalty Policy 4 (1991).
The reason for this penalty policy is clear. If firms only pay nominal fines after harmful emissions, then they have little incentive to take the steps to comply with the law. Instead, they can profitably emit, and treat the fine as a cost of doing business. The decision in WV v. EPA therefore only matters to the extent that the EPA would have used its authority to impose stringent fines on firms, thereby deterring violations and combating climate change.
Unfortunately, we do not know whether the fines imposed by the EPA are in fact sufficient. While the EPA does publicize large fines, it is not clear whether even these fines are large enough to induce firms to comply with the law, or are just a slap on the wrist. If the EPA effectively penalizes violations, then the efforts of politicians, advocates, and scholars on shoring up the power of the EPA are well-spent. However, if the fines are insufficient to deter misconduct, then the efforts to increase the power of the EPA are wasted, and more attention should be paid to how the EPA can effectively use the enforcement power it already has.
This paper therefore asks the question: taking into account penalties, do firms profit from violating environmental regulations? In this paper I study corporations’ private costs and benefits from noncompliance with the Clean Air Act given the prevailing structure of penalties to examine when noncompliance is profit-maximizing. To address this question, I use the universe of civil enforcement actions against stationary source emitters of pollution under the Clean Air Act.33.Stationary sources are fixed sources that emit pollution over a certain level. Stationary sources include power plants, refineries, petrochemical plants, and other large industrial sources. The large stationary sources of the type that I examine in this paper emit a large percentage of the United States’ total sulfur dioxides, nitrogen oxides, and greenhouse gasses. See infra Part I. I use the same methodology as the EPA to reconstruct the costs and benefits of noncompliance. I provide evidence that, in aggregate, noncompliance is profit-maximizing net of penalties, and that the largest violations are almost always profit-maximizing. The contribution and methodology of the paper can be summarized in an example drawn from the data.
In 2015, the EPA and the Department of Justice (DOJ) entered a settlement with ASARCO LLC for environmental violations at a copper smelter in Hayden, Arizona.44.ASARCO LLC Settlement, U.S. Env’t Prot. Agency (Nov. 3, 2015) https://www.epa.gov/enforcement/asarco-llc-settlement (https://perma.cc/JJ3A-2AVW). The settlement agreement required ASARCO to spend an estimated $150 million to come into compliance with regulations that ASARCO had been in violation of since 2005. Furthermore, the company had to pay a $4.5 million penalty, and was required to spend $9 million on supplementary projects including paving a local county road and performing lead-based paint abatement in nearby towns. The EPA touted the settlement in the news.55.Julia P. Valentine & Nahal Mogharabi, U.S. EPA Requires ASARCO to Cut Toxic Emissions at 103-Year-Old Arizona Copper Smelter (Nov. 3, 2015) https://www.epa.gov/archive/epa/newsreleases/us-epa-requires-asarco-cut-toxic-emissions-103-year-old-arizona-copper-smelter).html (https://perma.cc/P9NM-8BJT).
However, the fundamental question that must be asked is: was ASARCO’s noncompliance with the Clean Air Act profitable even after paying penalties? The company had avoided ten years of compliance from 2005 through 2015, and, under the terms of the consent decree, did not come into full compliance until 2019. In this period, ASARCO did not have to spend resources complying with the law, and the savings could either be paid to investors or profitably reinvested in other areas of the business.66.In personal finance terms, this is like a person who can delay a $1,000 mortgage payment for a year. In the intervening time, inflation means that $1,000 a year from now is worth less than 1,000 today. Moreover, the saved $1,000 can be invested, meaning that the individual will expect to have more than $1,000 in a year’s time. The profitability of noncompliance depends on ASARCO’s savings. As a rule of thumb, the EPA’s estimates a savings of “5% per year of the delayed one-time capital costs . . . for the period from the date the violation began until the date compliance was or is expected to be achieved.”77.Waste and Chem. Enf’t Div., Off. of Enf’t and Compliance Assurance, U.S. Env’t Prot. Agency, FIFRA Enforcement Response Policy 22 (2009), https://www.epa.gov/sites/default/files/documents/fifra-erp1209.pdf (https://perma.cc/P2HG-8UCH). Using this rule of thumb, ASARCO’s benefit from noncompliance was $147 million,88.$150,000,000 * (1.0514 – 1). for a benefit of noncompliance net of penalties of $133.5 million.
However, to better estimate the benefits of noncompliance, the EPA uses a specially-designed computer program to better estimate the costs and benefits of noncompliance. I describe the EPA’s penalty policy and the computer program in detail in Part I.99.Infra Part I. In brief, the calculation involves four steps. First, the EPA calculates how much it would have cost to comply on time by discounting the cost of compliance using an index of plant construction costs. In the case of ASARCO, this is an estimate of how much it would have cost to have complied in 2005. Second, the EPA calculates the cost of delayed compliance, by estimating how much the firm saved by delaying compliance, using the weighted average cost of capital as a proxy. For ASARCO, this estimates how much compliance in 2019 would cost in 2005 dollars. Third, the EPA calculates the “initial economic benefit”, which is the difference in the cost of compliance and the cost of noncompliance. In the ASARCO case, this is how much ASARCO saved from noncompliance in 2005 dollars. Fourth, because the initial economic benefit is in dollars in the year of noncompliance, the EPA then reflates the initial economic benefit to the current year, again using the weighted average cost of capital. For ASARCO, this is how much the firm profited by delaying compliance from 2005 to 2019. Using the EPA’s own methodology, I estimate ASARCO’s benefit from noncompliance to be approximately $32.5 million.1010. However, I discuss in Part II why this and my other estimates are likely to be underestimates of the true economic benefit of noncompliance. That is, relative to obeying the law in 2005, ASARCO made $32.5 million through noncompliance and paying the ultimate fine. Not only that, because I reproduce the precise program that the EPA uses when calculating fines, this means that the EPA was aware that the fine imposed on ASARCO was tens of millions of dollars less than would have been needed to comply with the EPA’s own policies. This means that ASARCO had little financial incentive to limit its emissions through compliance.
In this paper I use the universe of judicial enforcements of stationary source clean air violations to reconstruct the expected costs and benefits of each instance of noncompliance as calculated by the EPA. Using these violations, I find that a substantial portion of firms (36%) benefit from noncompliance, even after penalties are imposed. Moreover, I show that this effect is concentrated among the largest violations. I estimate that the aggregate value of all penalties imposed would need to be increased fivefold to achieve the EPA’s goal of removing the economic benefit from noncompliance. Furthermore, I perform several robustness checks to show that the results are robust to substantial changes in assumptions.
This conclusion is troubling both for the environment and for the functioning of the administrative state. Stationary sources include power plants, petroleum refineries, cement manufacturing plants, and other large industrial sources. Collectively, these sources emit a large portion of the United States’ total harmful emissions. Given that firms do not face meaningful reputational penalties from environmental violations, small penalties will not deter environmental harm.1111. Jonathan M. Karpoff et al., The Reputational Penalties for Environmental Violations: Empirical Evidence, 48 J.L. & Econ. 653, 671 (2005). More broadly, the results are disturbing for harmful corporate behavior in general. Corporations are not moral actors and can be expected to pursue private profits even when doing so causes broader social harms. Failures to punish corporations will result in more corporate law breaking.
Research on deterrence shows that if fines are too low, then individuals will engage in excessive malfeasance.1212. See Gary S. Becker, Crime and Punishment: An Economic Approach, 76 J. Pol. Econ. 169, 194-95 (1968). While corporations may experience extra-legal sanctions for law breaking, there are no meaningful reputational penalties following environmental harms.1313. Karpoff, supra note 11. Most fundamentally, this paper relates to rational, profit-maximizing malfeasance by corporations. Most of the literature on corporate malfeasance focuses on agency conflicts.1414. See generally Alan O. Sykes, The Economics of Vicarious Liability, 93 Yale L.J. 1231 (1984); Harry A. Newman & David W. Wright, Strict Liability in a Principal-Agent Model, 10 Int’l Rev. L. & Econ. 219 (1990); A. Mitchell Polinsky & Steven Shavell, Should Employees be Subject to Fines and Imprisonment Given the Existence of Corporate Liability? 13 Int’l Rev. L. & Econ. 239 (1993); Steven Shavell, The Optimal Level of Corporate Liability Given the Limited Ability of Corporations to Penalize their Employees, 17 Int’l Rev. L. & Econ. 203 (1997); Nuno Garoupa, Corporate Criminal Law and Organization Incentives: A Managerial Perspective, 21 Managerial & Decision Econ. 243 (2000). However, in some cases, the interests of shareholders and employees are aligned, and the conflict is instead between the corporation and society more broadly.1515. See generally Anat R. Admati, A Skeptical View of Financialized Corporate Governance, 31 J. Econ. Persp. 131 (2017); Nathan Atkinson, Mandatory Equity Issuances as a First-Best Solution to Punishing Corporate Misconduct (Apr. 21, 2023) (working paper), https://ssrn.com/abstract=4425727 (https://perma.cc/7625-V9H9).
This paper relates closely to Professors Roy Shapira and Luigi Zingales, who show that toxic emissions by the company DuPont were an ex ante profit maximizing choice.1616. Roy Shapira & Luigi Zingales, Is Pollution Value-Maximizing? The DuPont Case 5 (Nat’l Bureau of Econ. Rsch., Working Paper No. 23866, 2017). The authors calculate that if probability of detection was less than 19%, the emissions were ex ante profit maximizing for the firm. This paper builds upon Shapira and Zingales in two key ways.1717. Id. at 3. First, I consider hundreds of environmental violations rather than just one. Second, while Du Pont’s emissions were profit-maximizing ex ante, they were not profit maximizing ex post. In this paper, I show that many firms profit from pollution even after penalties are imposed. In other words: even if detection is certain, it is often profitable to break the law.
The remainder of the Paper is organized as follows. In the first Part, I present the institutional details of the Clean Air Act and the EPA’s penalty policy. In Part II, I describe the data and empirical strategy and present the results, including robustness checks. In Part III, I discuss the effects of enforcement actions on harmful emissions. Finally, I conclude with thoughts on the regulatory environment and avenues for future research.
I. Legal and Institutional Background
The Clean Air Act (CAA) is the comprehensive federal law that regulates air emissions.1818. Clean Air Act, 42 U.S.C. §§ 7401-7671 (2018). The CAA is enforced by the Environmental Protection Agency (EPA), which has the authority to establish air quality standards to protect the public health and welfare and to regulate the emissions of hazardous air pollutants. The focus of this paper is stationary sources. A stationary source is “any building, structure, facility, or installation which emits or may emit any air pollutant.”1919. Id. §§ 7411(a)(3), 7412(a)(3). Common stationary source violators include power plants, refineries, petrochemical plants, smelters, and other large industrial sources. Stationary sources are among the largest emitters of many types of harmful pollutants and greenhouse gases.2020. The enforcement of environmental laws under the Clean Air Act is implemented both at the state and the federal level. In particular, the EPA sets the National Ambient Air Quality Standards (“NAAQS”) and states have the primary responsibility for implementing the standards. Id. § 7409(d). The plans implemented by states must include enforceable emission limitations, id. § 7410(a)(2)(A), adequate personnel and funding, id. § 7410(a)(2)(E), and enforcement authority. Id. § 7410(a)(2)(C). The EPA retains ongoing authority to review state plans to enforce standards. Id. § 7410(c)(1). If a state plan is “substantially inadequate,” the EPA provides notification and requires compliance. Id. §§ 7410(k)(5), 7502(d). If a state fails to submit an adequate plan, the EPA can impose sanctions on the state, id. § 7509(b)(2), and the EPA must implement a federal plan. Id. § 7410(c)(1). If states fail to comply, the EPA may ban the construction or modification of any major stationary sources. Id. § 7413(a)(5).
In this paper I examine federal enforcement actions brought by the EPA. Most of the fines imposed by the EPA are administrative and are used for relatively simple and routine violations with short compliance schedules.2121. Id. § 7413(d). Administrative fines are capped at $200,000, but can be higher following DOJ consultation and consent. The EPA can also seek criminal sanctions against any person who knowingly violates most of the statute’s requirements.2222. Id. § 7413(c). My primary focus in this paper is on penalties that arise through civil enforcement actions. The EPA can commence a civil action whenever an operator is in violation of or has violated almost any requirement or prohibition of the CAA.2323. Id. § 7413(b)(2). The EPA can bring a civil action for any violations of Title I, Section 303 of Title III, Title IV, Title V, Title VI, or a State Implementation Plan (SIP). Civil cases are referred to the DOJ and are brought by the Environmental and Natural Resources Division.
The EPA’s imposition of civil penalties is supported by three other aspects of the enforcement regime. First, the EPA has broad authority to gather information and inspect,2424. Inspectors can enter facilities to access records, inspect equipment, sample emissions, determine violations, and gather other information. Id. § 7414. including requiring operators to install and use monitoring equipment, make reports, and establish and maintain records.2525. Id. § 7414(a)(1). Second, the EPA can issue orders to stop noncompliant construction.2626.” em>.Id. Third, the EPA can file suit in District Court to immediately stop the violation.2727.” em>.Id.
Under the CAA, the nonexclusive list of factors that the EPA and courts consider when assessing penalties include “the size of the business, the economic impact of the penalty on the business, the violator’s full compliance history and good faith efforts to comply, the duration of the violation as established by any credible evidence (including evidence other than the applicable test method), payment by the violator of penalties previously assessed for the same violation, the economic benefit of noncompliance, and the seriousness of the violation.”2828.” em>.Id. The maximum fine varies based on the type of violation, but can be as much as $101,439 per penalty per day.2929. See id. § 7413(b); 40 C.F.R. § 19.4 (2023). In 1970 the penalty was set at $25,000, but this has been increased with inflation. This works out to a maximum fine of roughly $37 million per violation per year. Even though many violations last for many years, the largest penalty (including the cost of supplementary environmental projects) imposed on any firm for a stationary source violation is $24 million.3030. Illinois Power Company and its successor Dynergy Midwest Generation paid a civil penalty of $9 million and was required to spend a further $15 million on supplementary environmental projects. Illinois Power Company and Dynegy Midwest Generation Settlement, U.S. Env’t Prot. Agency (Mar. 7, 2005), https://www.epa.gov/enforcement/illinois-power-company-and-dynegy-midwest-generation-settlement (https://perma.cc/25M4-2BXR).
The penalties that I analyze in this paper are guided by the 1984 EPA Policy on Civil Penalties,3131. U.S. Env’t Prot. Agency, Policy on Civil Penalties: EPA General Enforcement Policy (1984). and the 1991 Clean Air Act Stationary Source Civil Penalty Policy.3232. U.S. Env’t Prot. Agency, supra note 2. These penalty policies stipulate two overarching goals. First, the penalty should increase in the seriousness of the violation. This gravity component is meant to increase in factors such as the harm done, the possible harm, the size of the violator, the length of the violation, the toxicity of the pollutant, the length of the violation, the degree of noncooperation with the EPA investigation, and the degree of the willfulness or negligence. The gravity component is factored into the penalty imposed, but it is not the primary focus of this paper.
The second component of the penalty is the economic benefit component. This captures the idea that “any penalty should, at a minimum, remove any significant economic benefits resulting from noncompliance.”3333. Id. at 4 The economic benefit component is premised on the idea that corporations save money through noncompliance. For example, a corporation that does not install a scrubber at a plant saves the cost of the scrubber and can use that money to pay shareholder dividends or make other profitable investments. When a civil action is ultimately brought against the corporation, it will need to install the scrubber. However, by deferring the costs until the enforcement action, the corporation has profited. The goal of the economic benefit component is to set the penalty high enough so that the corporation does not benefit from delayed compliance.3434. However, there may be other mitigating factors that will lower the penalty imposed. The CAA Stationary Source Penalty Policy stipulates that “The economic benefit component may be mitigated where recovery would result in plant closings, bankruptcy, or other extreme financial burden, and there is an important public interest in allowing the firm to continue in business.” Id. at 7. Given this, Atkinson, supra note 15, shows how corporations can exploit collateral consequences, leading to underdeterrence.
As a baseline, the EPA has established a rule-of-thumb that “the economic benefit of delayed compliance may be estimated at: 5% per year of the delayed one-time capital costs . . . for the period from the date the violation began until the date compliance was or is expected to be achieved.”3535. Waste and Chem. Enf’t Div., supra note 7. So, for example, if the scrubber costs $1 million to install, and the corporation is able to delay installation for one year through noncompliance, its estimated economic benefit from delayed compliance is 5% of $1 million, or $50,000. And because the benefit compounds over time, the economic benefit will increase by an increasing amount each year. After two years, the estimated economic benefit from delayed compliance will be $102,000, after five years the estimated economic benefit from delayed compliance will be $276,000, and after ten years the economic benefit from delayed compliance will be $628,000. The economic benefit component is meant to eliminate these profits. The 5% per year is a rule-of-thumb that is meant to approximate the gain. For a small delayed cost over a short period of time, the heuristic will perform reasonably well. However, for a large violation and a longer time period, the 5% may be off by a large amount. For example, a $1 million cost delayed over ten years at 5% a year creates an economic benefit of $628,000. However, the same cost at 7% a year creates an economic benefit of $967,000. The assumptions around the rate of return can have large impacts on the estimated economic benefit. Moreover, the cost of the scrubber may increase in the interim, which could have an attenuating effect on the economic benefit. To address this issue, the EPA uses a specially-designed computer program, BEN, to more accurately calculate the economic benefit component.3636. Penalty and Financial Models, U.S. Env’t Prot. Agency, https://www.epa.gov/enforcement/penalty-and-financial-models (https://perma.cc/SD9V-NXFN) (July 11, 2022). The BEN computer program calculates the economic benefit in four steps that I recreate in this paper:
A. Calculation of the Cost of Complying on Time
The first step is to understand how much it would have cost the firm to have complied with the law on time. To calculate this, the EPA estimates how much it would cost the firm to comply today. According to the EPA, “[t]he best evidence of what the violator should have done to prevent the violations is what it eventually does (or will do) to achieve compliance.”3737. Off. of Enf’t, U.S. Env’t Prot. Agency, EPA 300-B-94-002, BEN: A Model To Calculate The Economic Benefits Of Noncompliance, User’s Manual 6-2 (1993). Therefore, if a corporation installs a scrubber to eventually achieve compliance, the EPA assumes that the violator should have installed a scrubber to achieve compliance at the point of noncompliance. The cost of installing the scrubber today is then used to calculate the cost of compliance.
However, the cost of compliance is not constant over time. Due to inflation, technological progress, and changing economic conditions, the cost of compliance today will differ from the cost of compliance when noncompliance first occurred. The largest costs incurred by stationary sources are construction costs, which increase over time. This means that if it costs $1 million to comply today, it likely would have cost less than $1 million at the point of non-compliance.3838. This is certainly not always true. Technological innovation means that many costs may fall over time. To approximate the cost at the point of noncompliance, BEN deflates the cost of compliance by the Chemical Engineering Plant Cost Index. This index, published by Chemical Engineering magazine is used because it purportedly “accurately reflects the costs of activities associated with pollution-control expenditures. The [Plant Cost Index] is based on cost changes in typical components of pollution control, including equipment, construction labor, buildings, and engineering and supervision.”3939. Off. of Enf’t, supra note 37, at 4-28. The BEN program also allows the user to choose a different cost index, including the Construction Cost Index, the Employment Cost Index, the Gross Domestic Product Implicit Price Deflator, the Producer Price Index for Finished Goods, or a constant rate of inflation. Deflating the cost of complying today by the Plant Cost Index yields an estimate of how much it would have cost the firm to comply on time.
Consider a plant that was non-compliant from 2000 through 2010 and spent $1 million on compliance in 2010. Using the Plant Cost Index, the estimated cost from complying on time is $708,192.4040. The index in December 2000 was 396.8. The index in December 2010 was 560.3. Therefore, the estimated cost from compliance is (396.8/560.3)*$1,000,000 = $708,192.
B. Calculation of the Cost of not Complying on Time
The second step is to calculate the cost of delayed compliance at the point where the firm became non-compliant. To calculate this, BEN uses the cost of delayed compliance discounted to the point of noncompliance. The discounting is meant to capture the profits that the company made from delaying costs. To estimate the costs of not complying on time, BEN uses the Weighted Average Cost of Capital (WACC). WACC represents the returns that the corporation is expected to pay to its investors. The value of WACC can be thought of as an approximation of the profits that the firm would make with a given amount of money.4141. For a firm that is funded only through equity and debt, the weighted average cost of capital is calculated by equation as listed in PDF version of this article. The EPA does not calculate a firm-specific WACC, but instead uses the “weighted-average cost of long-term debt and equity capital over the most recent ten years for a firm of average risk.”4242. Off. of Enf’t, supra note 37, at 4-31. In my analysis, I use the values calculated by the EPA. Over the time period from 1987 to 2018, the WACC calculated by BEN ranged between 6.8% in 2012 and 11.2% in 1987.4343. Data on file with author.
Consider again a firm that was non-compliant from 2000 through 2010 and spent 1 million on compliance in 2010. Using the average WACC, the expected cost of noncompliance in 2000 was $426,003.4444. Discounting according to WACC is an iterative process. See full equation and explanation in PDF version of this article. This can be interpreted as the amount that the company would have had to invest in 2000 in order to have $1 million in 2010.
C. Calculation of the “Initial Economic Benefit”
Once the cost of complying on time and the cost of delayed compliance are calculated, BEN calculates the initial economic benefit. The initial economic benefit is the difference between the costs of on time compliance from step 1 and the costs of delayed compliance from step 2, at the point where the firm became non-compliant.
The firm that was non-compliant from 2000 through 2010 and spent $1 million on compliance in 2010 is estimated to have an initial economic benefit of $708,192 – $426,003 = $282,189.
D. Calculation of Current “Economic Benefit”
The initial economic benefit is in terms of dollars in the year of noncompliance. The final step in calculating the economic benefit is reflate that benefit to the present year. BEN does so by again using WACC, which is meant to capture the return on an investment equal to the initial economic benefit. In principle, the penalty imposed should be sufficiently high so that it removes this benefit from the firm.
For the firm that was non-compliant from 2000 through 2010 and spent $1 million on compliance in 2010, the current economic benefit (in 2010) is $662,270.4545. Like step 2, the reflation is an iterative process. The WACC in 2001 was 10.4%, so the economic benefit in 2002 was $282,189 * 1.14 = $311,470. This process continues for the values of WACC in note 44.
These four steps are meant to more accurately estimate the economic benefit than the 5% rule of thumb. There are several assumptions that go into this calculation that could be debated, and there is uncertainty on the part of the EPA when choosing values. However, the Penalty Policy makes it clear that the when there is uncertainty, “the economic benefit of noncompliance . . . should be calculated under this penalty policy using the most aggressive assumptions supportable.”4646. U.S. Env’t Prot. Agency, , supra note 2, at 1.
The EPA then adds the economic benefit component to the gravity component to calculate the penalty to be imposed. If the EPA and the target firm agree, the monetary penalty can be reduced dollar for dollar in exchange for the company performing supplementary environmental projects such as installing solar panels, retrofitting school buses, or paving roads.
II. Analysis
A. Data and Empirical Strategy
The primary data come from the EPA’s ECHO database. I use the federal enforcement and compliance data from the integrated compliance system, which is used to track federal enforcement cases.4747. ICIS – FE&C Download Summary and Data Element Dictionary, U.S. Env’t Prot. Agency, https://echo.epa.gov/tools/data-downloads/icis-fec-download-summary (https://perma.cc/D962-FU7Z) (Mar. 2, 2023). The analyses in this paper are on data downloaded on May 8, 2023. The analysis includes all violations that had complaints filed by 2019. This data along with replication files are available at https://www.nathanatkinson.com. This database contains administrative and judicial cases under a variety of statutes. I restrict attention to judicial cases where the primary violation is the CAA.4848. For administrative cases, there is generally no means to estimate the duration of noncompliance, so it is not possible to estimate the economic benefit. I drop cases for moving sources under Title II of the CAA.
To estimate firms’ benefits from noncompliance, I recreate the methodology used by the BEN computer program. To do so, I use data from ECHO on the cost of compliance, the duration of noncompliance, and the penalty imposed.
The Cost of Compliance variable is the “[d]ollar value of sum of compliance action amounts (derived value from ECHO). This field is the settlement-level sum of the dollar values of injunctive relief and the physical or nonphysical costs of returning to compliance. Injunctive relief represents the actions a regulated entity is ordered to undertake to achieve and maintain compliance, such as installing a new pollution control device to reduce air pollution, or preventing emissions of a pollutant in the first place.”4949. ICIS – FE&C Download Summary and Data Element Dictionary, supra note 47. Because compliance generally only occurs after the consent order, it is possible that the cost of compliance variable is an underestimate or an overestimate of the true cost of compliance.5050. While I cannot estimate the accuracy of the estimate, I perform robustness checks by inflating the cost of compliance.
The economic benefit from noncompliance is a function of the amount of time from noncompliance to compliance. Unfortunately, the ECHO database does not contain data on the date of noncompliance or the date of compliance. Instead, I proxy the duration of noncompliance using dates that are available. I use the date on which the case was referred to the DOJ as a proxy for the date of noncompliance. This date will necessarily be after the true date of noncompliance. To proxy for the date of eventual compliance, I use the date that a complaint is filed with the court. Because almost every civil case ends in a consent decree rather than a judicial decision, this date can be interpreted as the settlement date. Because the consent decree specifies the compliance actions, the date of compliance will occur after the date of the consent decree. I drop cases that do not have these dates.
Using these dates as proxies, my estimates of the duration of noncompliance is almost certainly a gross underestimate of the time of delayed compliance. This can therefore be expected to bias my estimates of the economic benefit of noncompliance downwards, which in turn means that my estimates of the net benefit of noncompliance are biased downwards.
To calculate the economic benefit from noncompliance I reconstruct the four steps that the EPA uses using the firm’s cost of compliance and the dates of DOJ referral and the consent decree. I take the values of the Plant Cost Index and the Weighted Average Cost of Capital directly from the BEN computer program. I then calculate the net benefit from noncompliance by subtracting the penalty from the economic benefit of noncompliance.5151. I sum the monetary value of federal penalties imposed, state and local penalties imposed, and supplementary environmental projects.
I recreate the EPA’s methodology by using data from the EPA on the date of non-compliance, the date of compliance, and the cost of compliance.5252. See explanation in PDF version of this article. The first step is to calculate the cost of complying on time, which is the cost of compliance at the time of compliance, deflated according to the Plant Cost Index at the time of noncompliance.5353. See explanation in PDF version of this article.
Next, the cost of not complying on time is calculated by discounting the cost of complying according to the weighted average cost of capital. The weighted average cost of capital values that I obtain from the EPA are annual rates. However, because noncompliance may only occur for part of a year, I calculate a daily weighted average cost of capital that compounds daily.5454. See explanation in PDF version of this article. The cost of not complying on time is therefore calculated by dividing the cost of compliance by weighted average cost of capital.5555. See explanation in PDF version of this article.
The initial economic benefit is then the difference between the cost of complying on time and the cost of not complying on time.5656. See explanation in PDF version of this article. Next, the economic benefit of noncompliance is then calculated by reinflating the initial economic benefit by the weighted average cost of capital.5757. See explanation in PDF version of this article. Finally, the net benefit from noncompliance is the benefit from noncompliance minus the penalty imposed.5858. Net Economic Benefit = (Economic Benefit)-(Penalty). In the next Section, I present a detailed analysis of ASARCO. In the following Section, I present results from the entire universe of penalties.
B. ASARCO Example
On June 12, 2002, a new EPA rule went into effect regarding emissions standards for hazardous air pollutants for primary copper smelting.5959. National Emission Standards for Hazardous Air Pollutants for Primary Copper Smelting, 40 C.F.R. § 60 (2002). The rule established new emission standards and established requirements to demonstrate compliance with applicable emission limitations. The standards applied to “major source” smelters that had the potential to emit sufficiently high levels of hazardous air pollutants,6060. 42 U.S.C. § 7412(a)(1) (2018). and existing major sources were given three years to come into compliance with the new rule.
ASARCO claimed “minor source” status since the effective date of June 13, 2005 for its copper smelter in Hayden, Arizona. However, a 2011 EPA investigation found that ASARCO had been in continuous violation of the standards since June 13, 2005. This noncompliance continued through the entering of a consent decree in 2015. The consent decree estimated that ASARCO’s cost of coming into compliance was $150 million. Additionally, ASARCO had to pay a $4.5 million civil penalty, and was required to spend 9 million on supplementary projects including paving a local county road and performing lead-based paint abatement in nearby towns.6161. ASARCO LLC Settlement, supra note 4. In principle, the fine imposed (including the cost of supplementary environmental and mitigation projects) should “at a minimum, remove any significant benefits resulting from failure to comply with the law.”6262. U.S. Env’t Prot. Agency, supra note 2, at 4. To determine the benefits of noncompliance, I use the same methodology that the EPA uses.
Doing so requires four pieces of data: (1) how much it would have cost the firm to comply on time; (2) how much it ultimately cost the firm to comply; (3) the date of noncompliance; and (4) the date of compliance.
I proxy for the date of noncompliance by using the date that the complaint of noncompliance was filed: September 28, 2011 in this case. For the date of compliance, I use the date of the consent decree as a proxy: November 3, 2015 in this case. As will be discussed below, these assumptions significantly underestimate the true economic benefit of noncompliance.
I first calculate how much it would have cost ASARCO to comply in 2011 instead of 2015 by deflating the $150 million to 2011 using the Chemical Engineering Plant Cost Index. This results in an estimate that it would have cost ASARCO $142.7 million to have complied in 2011.
Second, I estimate the cost of not complying on time by deflating the $150 million cost of compliance in 2015 to 2011 using the WACC. This is meant to capture the profits that ASARCO made by avoiding the costs, and can be thought of as how much ASARCO would have to have invested in 2011 in order to pay the 2015 compliance costs of $150 million. This yields $118,300,000.
Third, I calculate the initial economic benefit, which is the difference between these two values, $24,400,000. This is how much ASARCO saved in 2011 dollars by not complying with the law.
Fourth, I reinflate the 2011 initial economic benefit to 2015 to estimate the current economic benefit, $32,597,412. This is the estimate of how much ASARCO profited from noncompliance at the time the consent decree was signed. In principle, the fine imposed should be sufficient to remove this benefit. I calculate the net benefit today by subtracting off the penalty and the Supplementary Environmental Project amount ($13,500,000). This leads to an estimated value of $19,097,412, after having paid the fine. Based on these calculations, ASACRO made considerable profits through noncompliance.
Note, that despite the fact that the fine was considerably smaller than ASARCO’s economic benefit, the statutory guidelines provided room for a considerably larger penalty. Under the statutory maximum civil penalty guidelines, ASARCO could be fined $138,880,000 for its noncompliance through the signing of the consent decree.6363. 42 U.S.C. § 7413(a)(3) (asserting that a civil action can be brought with penalties calculated per day). See also 40 C.F.R § 19.4 (2023) (noting that ASARCO could be fined $32,500 per day through January 12, 2009 and $37,500 per day through the date that the consent decree was signed).
I estimate ASARCO’s economic benefit from noncompliance to be $32,597,412. However, this is likely a dramatic underestimate for three reasons. First, the complaint and consent decree show that ASARCO’s noncompliance began on June 13, 2005—over six years before the date of the complaint, which I use as a proxy for the date of noncompliance. Second, the consent decree did not require full compliance with the regulations until the end of 2019, and news reports show that ASARCO did not finish coming into compliance until August, 2019—nearly four years after the consent decree was signed. And third, while the EPA estimated that the cost of compliance would be 150 million, the realized cost was $229 million. Using the same methodology with this new information, I estimate that ASARCO’s economic benefit from noncompliance in 2019 may have been as high as $185,000,000.6464. Note, however, that while ASARCO did not come into full compliance until 2019, it incurred the costs of coming into compliance over the years between 2015 and 2019. The earlier the costs were incurred, the less ASARCO’s economic benefit would be. Furthermore, because penalties could have been imposed for the entire duration of noncompliance, the maximum penalty that could have been imposed upon ASARCO may have been as high as $275,143,927.
C. Descriptive Results
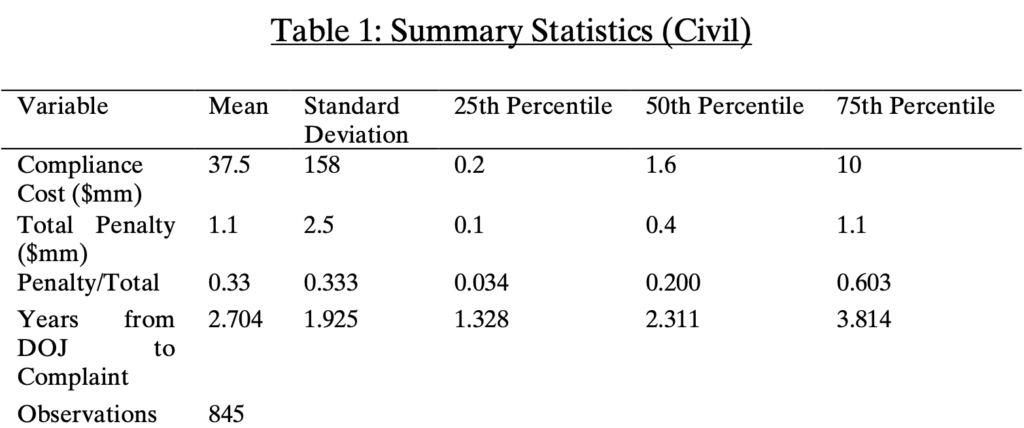
Before reconstructing the economic benefit of noncompliance, I first provide descriptive results. Table 1 provides summary statistics from the universe of civil stationary source violations of the CAA. The average (median) cost of coming into compliance is $37.5 million ($1.57 million), and the average (median) penalty imposed is $1.1 million ($400,000). The average (median) ratio of the penalty to the total cost is 0.33 (0.2). The mean (median) time from the date that the case was referred to the DOJ to the day that a complaint was filed with the court is 2.7 years (2.3 years).
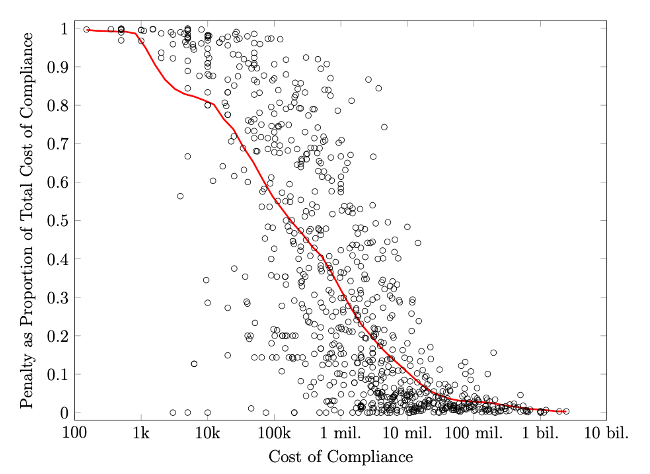
However, these numbers do not capture the skew in the data. Figure 1 plots the raw data. On the horizontal axis is the cost of compliance. On the vertical axis is the penalty as a percentage of the total cost. The red line is a local polynomial that estimates the relationship between the cost of compliance and the penalty as a proportion of the total cost.6565. A local polynomial regression builds upon the classical linear regression in that it is more flexible and can better capture nonlinear relationships. In this case, the local polynomial shows that the relationship between the cost of compliance and the ratio is not linear.
Figure 1 illustrates that the penalty comprises almost the entire cost for cases where there is a low cost of compliance. However, increasing the cost of compliance is associated with a decrease in the penalty as a proportion of the total cost. For the largest violations, the penalty imposed is a tiny fraction of the total cost incurred by the firm. Across all civil cases, the total cost of compliance is $31.7 billion. The total penalties imposed are $961 million. This means that, in aggregate, penalties comprise only 3% of total costs of noncompliance borne by corporations. Given that the average case takes over two and a half years from the date of DOJ referral to the date of the complaint, the 3% penalty rate may mean that firms profit net of the fine imposed. I explore this in the next Section.
Figure 1: Penalty as a Proportion of the Total Cost of Compliance
D. Reconstructing the Economic Benefit
This Section presents results for reconstructing the economic benefit from delayed compliance. As discussed in Part II, Section A, I assume that the date of noncompliance is the date that the case was referred to the DOJ, and the date of compliance is the date that the consent order was filed with the court. Using these dates almost certainly underestimates the duration of noncompliance, which means that the results that I find should be biased downwards.
The estimated economic benefit from delayed compliance ranges from a low of $15 to a high of $380,000,000. The median economic benefit is $130,000 and the mean economic benefit is $5.3 million. Figure 2 plots the estimated economic benefit as a function of the cost of compliance. Each point represents one violation. The solid red line is a local polynomial of the estimated economic benefit as a function of the cost of compliance. This illustrates that the estimated economic benefit is increasing in the cost of compliance, which follows from the fact that each dollar of delayed costs confers a benefit.
Figure 2: Estimated Economic Benefit as a Function of Cost of Compliance
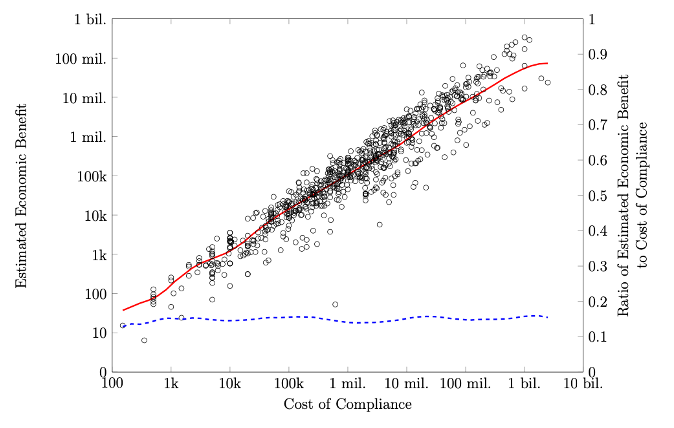
The dashed blue line is the ratio of the estimated economic benefit to the cost of compliance as a function of the cost of compliance. In other words, this is the estimated economic benefit, controlling for the cost of compliance. This ratio is stable at approximately 15% across the range of violations. The stable ratio of estimated economic benefit for the cost of compliance means that an increase in the cost of compliance of $1 is associated with an increase in the economic benefit of roughly $0.15.
In principle, the penalty imposed upon the corporation for noncompliance should be at least as large as the economic benefit from noncompliance. This would remove any economic benefit from not complying with the law. However, while the ratio of the economic benefit to the cost of compliance is stable in the cost of compliance, the relative size of the penalty is decreasing in the economic benefit of noncompliance.
Figure 3 plots the ratio of the penalty to the economic benefit as a function of the economic benefit. If the ratio of the penalty to the economic benefit is greater than one, the firm is estimated to have paid more in penalties than it benefited from the violation. Ex post, I estimate that these firms did not profit from noncompliance. If the ratio is less than one, the firm’s benefit from noncompliance is estimated to be greater than the penalty. These are firms that I estimate to have profited from noncompliance ex post.
Figure 3: Ratio of Penalty to Economic Benefit as a Function of Economic Benefit
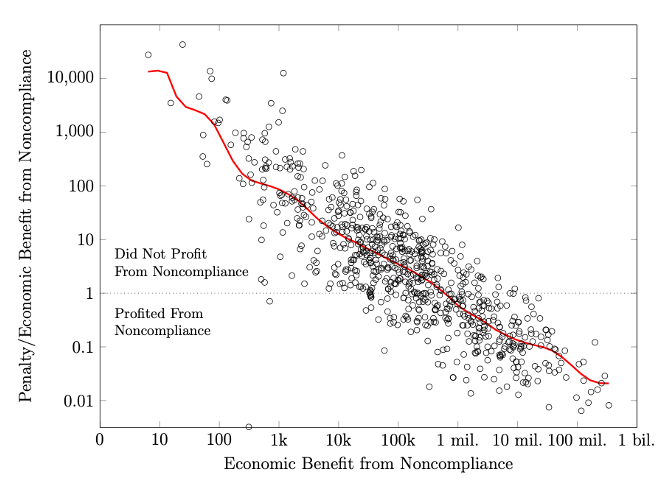
Figure 3 illustrates a robust negative relationship between the estimated economic benefit of noncompliance and the ratio of the penalty to the economic benefit of noncompliance. For low values of estimated economic benefit, the penalty is orders of magnitude greater than the economic benefit. The penalty is expected to be greater than the economic benefit for estimated economic benefits of less than $706,000. However, beyond this amount, the expected penalty is less than the estimated economic benefit from noncompliance. For firms with large estimated economic benefits from noncompliance—these are generally firms that have high costs of compliance—the penalties imposed are smaller than their benefits for noncompliance. For the violations with the largest economic benefit, the penalty is only a tiny fraction of the economic benefit.
Restricting attention to the 25% of violations with the highest costs of compliance (cost of compliance > $10 million), the median estimated economic benefit is 6.3 times larger than the penalty imposed; for the largest 10% of violations (cost of compliance > $67 million), the median estimated economic benefit is 7.9 times larger than the penalty imposed; for the largest 5% of violations (cost of compliance > $1.67 billion), the median estimated economic benefit is 16.7 times larger than the penalty imposed. The profitability of large violations far outweighs the unprofitability of small violations. Summing across all violations, the total penalties imposed are $961 million, while the total economic benefit from noncompliance is $4.15 billion. This means that, in aggregate, penalties would have to be 4.3 times greater in order to remove the economic benefit of noncompliance.
According to EPA policy, the penalty imposed should be greater than or equal to the economic benefit. This implies that the ratio of the penalty to the economic benefit should always be greater than one. However, Figure 3 rejects this interpretation. For large set of cases, the ratio if the penalty to the economic benefit is less than one, and often significantly so. This implies that there are a large set of violations where the EPA did not impose a penalty sufficient to remove the economic benefit from noncompliance. This provides evidence that the penalties imposed by the EPA are not achieving the fundamental goal of removing the economic benefit from noncompliance.
E. Robustness Checks
In this Section I perform a number of robustness checks. In each robustness check, the methodology of calculating the economic benefit from noncompliance is altered. I then calculate the proportion of violations that are profitable for the given economic benefit. I also calculate the net profitability across all violations and present the point at which the net profitability switches from being negative to positive. These robustness checks show that net profits from noncompliance are highly robust to errors in the data and assumptions
The Cost of Compliance variable provided by the EPA is an estimate of the cost of compliance. This estimate is produced in consultation with the target corporation. Because the cost of compliance is used to calculate the economic benefit and the penalty, errors in the cost of compliance estimate will affect the penalty and the potential profitability of noncompliance.
To examine the robustness of the results, I calculate the economic benefit assuming that the cost of compliance is systematically wrong. Given that C is the estimated cost of compliance, let C be the cost of compliance scaled by an error term . The economic benefit given errors in the cost of compliance is therefore calculated as follows:
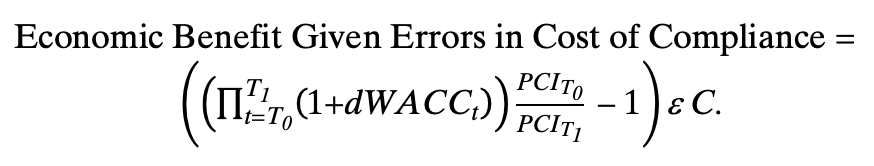
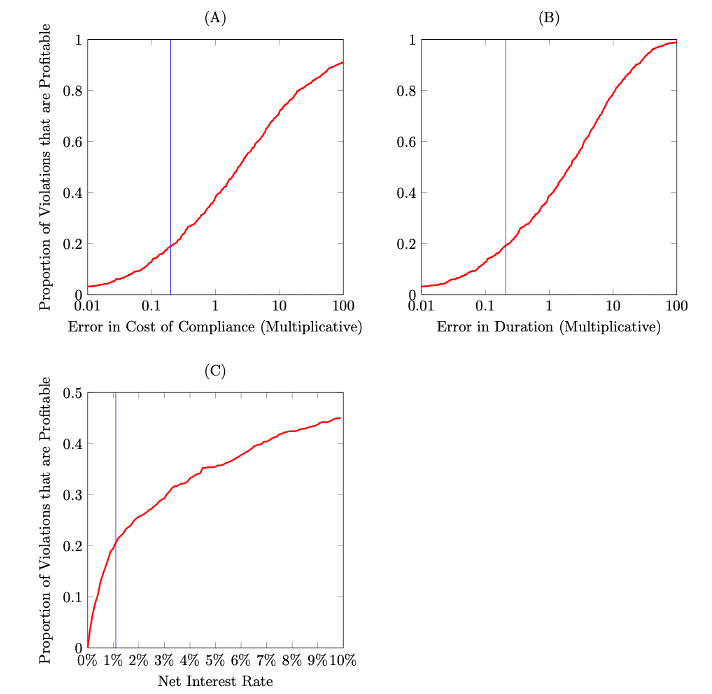
Figure 4(A) plots the proportion of violations for which noncompliance was profitable for the firm as a function of systematic errors in the cost of compliance. The horizontal axis scales the cost of compliance for all violations. The range of this scaling is from .01 (the true cost of compliance is only 1% of the estimate) to 100 (the true cost of compliance is 100 times the estimate). The penalties imposed on firms for violations are kept constant. The figure shows that approximately 36% of violations are profitable if the cost of compliance as calculated by the EPA is correct. The figure shows that a substantial portion of firms profit from noncompliance even in the presence of systemic overestimation of costs (15% are profitable if costs are overestimated by a factor of 10, and 3.1% remain profitable if costs are overestimated by a factor of 100). If costs are underestimated, an increasing portion of violations are profitable. This indicates that, so long as the EPA is not grossly and systematically underestimating the costs of compliance, there are a substantial portion of violations that are profitable. The vertical line at 0.2 represents the error level for which the net-profitability across all violations is equal to zero. If the cost of compliance is over-estimated by more than 5 times, then the total costs from noncompliance are greater than the total benefits from noncompliance. Whereas, if the cost of compliance is overestimated by less than 5 times (or not overestimated at all), then the total costs from noncompliance are less than the total benefits of noncompliance.
The main analysis uses an estimate of the duration of noncompliance based on the duration from the date that the case was referred to the DOJ and the date that a complaint was filed. As discussed in Part II, Section A, this is likely an underestimate of the duration of noncompliance. The duration of noncompliance is used to calculate the economic benefit of from noncompliance, so errors in the duration will affect the penalty and the potential profitability of noncompliance. However, because this estimate of the duration of noncompliance is almost certainly biased downwards, this will in turn bias the estimated economic benefit downwards.
Figure 4: Robustness of Profitability6666. The vertical blue line indicates the value for which the net profitability across all violations is equal to 0.
To examine the robustness with respect to errors in the duration of noncompliance, I calculate the economic benefit assuming that the duration of noncompliance is systematically wrong. Because scaling the time upwards can lead to a duration of noncompliance that begins before the establishment of the EPA or ends far into the future, I scaled the time by using the same calculated values for the cost index and the WACC, and then scaled this value according to an error term , as follows:
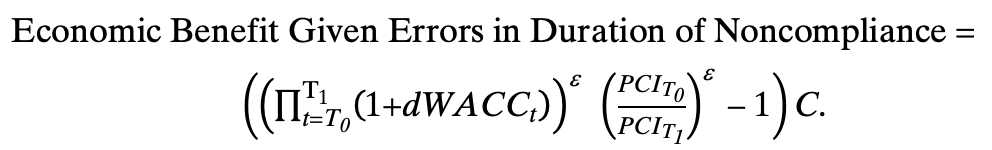
Figure 4(B) plots the proportion of violations for which noncompliance was profitable for the firm as a function of systematic errors in the cost of compliance. The horizontal axis scales the duration of noncompliance from 1% of the estimate used in the main analysis to 100 times that estimate. The penalties imposed on firms for violations are kept constant. The figure shows that a substantial portion of firms profit from noncompliance even when the duration of noncompliance is overestimated. For example, 13% of violations remain profitable if the estimate of the duration of noncompliance is overestimated by 10x. However, this would in turn imply that the average duration of noncompliance was an implausibly short 96.1 days. The vertical line is the error level at which the net-profitability of violations across all firms is equal to 0. This line is at 0.208, meaning that the estimate of time must be overestimated by at least 4.8 times (1/.208=4.8) before the net-profitability of all violations becomes negative. Given the working assumption that the duration of noncompliance is the duration from the date that the case was referred to the DOJ and the date that the complaint was filed, the duration of noncompliance is likely an underestimate.
The EPAs calculation of the economic benefit depends on price indices and assumptions about firms’ cost of capital. In principle, these values can help tailor the economic benefit of noncompliance to the individual firm. However, these assumptions also complicate and obfuscate the calculation of penalties. For this reason, the EPA stipulates a rule of thumb that “the economic benefit of delayed compliance may be estimated at: 5% per year of the delayed one-time capital cost for the period from the date the violation began until the date compliance was or is expected to be achieved.”6767. Waste and Chem. Enf’t Div. , supra note 7. Using a constant discount rate simplifies the analysis.
To examine the robustness of the economic benefit as a function of a constant net benefit, I take a given net interest rate, r, and calculate the economic benefit accordingly:

Figure 4(C) plots the proportion of violations for which noncompliance was profitable as a function of a constant interest rate. The plot is centered around the EPA’s rule-of-thumb interest rate of 5%.6868. Normalizing the net interest rate to a constant across all violations, I find that the average interest rate calculated according to the BEN methodology, 5.27%. The plot shows that a substantial portion of violations are profitable across a wide range of plausible net-interest rates. The blue line at 1.1% indicates the interest rate at which the net-profit from all violations is equal to zero.
III. The Effects of Enforcement on Emissions
What explains the relatively low fines imposed upon corporations? The most probable explanation for the low fines are resource constraints coupled with a desire to resolve the underlying environmental problem.6969. U.S. Env’t Prot. Agency, supra note 2, at 19 (“The preliminary deterrence amount, both economic benefit and gravity components, may be mitigated in appropriate circumstances based on litigation risk.”). While fines are meant to deter wrongdoing, officials also want the firm to come into compliance with the law. These fines are coupled with a commitment to come into compliance. EPA officials may therefore prefer correcting the instant of noncompliance rather than delaying compliance further while seeking increased penalties.
The importance of obtaining compliance can be seen by looking at the emission reductions following a consent decree. The three most common emissions of stationary source violators are nitrogen oxides (NOx), sulfur dioxide (SO2), and particulate matter (PM). Stationary sources regulated by the EPA are responsible for over 1/3 of the total U.S. NOx emissions, over 2/3 of SO2 emissions, and a large amount of PM emissions. When the EPA imposes a penalty upon a violator, officials also estimate the annual reduction in emissions that will follow compliance. Table 2 presents the total and average emissions reductions following EPA enforcement actions, with the firms separated based on the ex post profitability of noncompliance.
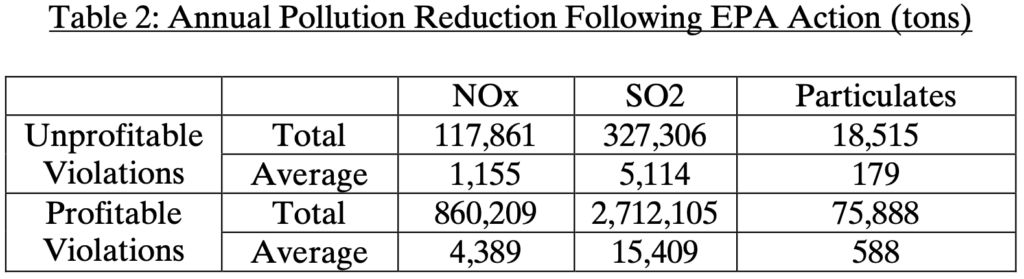
The reductions following EPA enforcement actions are substantial. Given that the most profitable violations tend to be the largest, the emissions reductions following profitable violations are much larger than unprofitable violations. To put these reductions in perspective, an estimated 20.3 million tons of NOx and 14.5 million tons of S02 were released in the United States in 2005. The estimated reductions following the enforcement actions are a significant reduction in the total emissions. The average resolution of a profitable violation reduces NOx emissions by 4,389 tons, SO2 emissions by 15,409 tons, and PM emissions by 588 tons. Using estimated costs of atmospheric releases of NOx and SO2, the average decrease in the social cost of pollution following an enforcement action of a profitable violation is between $67 million and $346 million per year depending on estimates of the social cost of emissions.7070. Drew T. Shindell, The Social Cost of Atmospheric Release, 130 Climatic Change 313, 319 (2015) (estimating the cost of a ton of NOx to be $2,600 to human health, and the cost of a ton of SO2 to be $20,000 ± $14,000 in both climate and health effects). So while the penalties imposed on these firms may be insufficient to ensure compliance ex ante, the social costs of the emissions may be so great that government officials prefer to quickly resolve the issue rather than further delaying compliance while seeking larger penalties.
The key mission of the EPA is to protect human health and the environment. While fines are important for creating the proper incentives, a key component of consent decrees are commitments to restore compliance going forward. Large penalties are more likely to be litigated by firms, which could lead to longer delays before ultimate compliance and reductions in emissions. While small penalties provide bad ex ante incentives to comply with the law, these penalties make it easier for the EPA to bring noncompliant firms into compliance.
There are other factors that could contribute to penalties that are insufficiently large. The EPA penalty policy allows for penalties to be reduced to avoid negative collateral consequences,7171. U.S. Env’t Prot. Agency, supra note 2, at 7 (“The economic benefit component may be mitigated where recovery would result in plant closings, bankruptcy, or other extreme financial burden, and there is an important public interest in allowing the firm to continue in business.”). and Atkinson7272. Nathan Atkinson, Corporate Liability, Collateral Consequences, and Capital Structure, Colum. Bus. L. Rev. (forthcoming 2023), https://www.nathanatkinson.com/wp-content/uploads/2020/10/Atkinson-Corporate-Liability.pdf (https://perma.cc/4VR5-WCYV). shows that governmental decision makers frequently (and often erroneously) reduce liability to avoid jeopardizing a firm’s solvency. However, given that large violations are always associated with relatively low fines, it is unlikely that concerns of collateral consequences are driving the low fines.
A second possible factor that can contribute to low fines is the gravity component of violations. While this paper focuses on the economic benefit component of the penalty calculation, violators are also penalized based on the gravity of the offense. Elements that contribute to the gravity component include the amount of excess pollution,7373. Id. at 10 (unpublished manuscript). the toxicity of the pollutant,7474. Id. at 11 (unpublished manuscript). the duration of the violation,7575. Id. at 12 (unpublished manuscript). the degree of willfulness or negligence,7676. Id. at 16 (unpublished manuscript). and the degree of cooperation.7777. Id. Increases in gravity will increase the penalty imposed upon the firm. However, adjustments to the gravity component are generally absolute, rather than relative to the size of the violation. For example, the gravity component for a violation lasting one month is $5,000, the gravity component for a violation lasting one year is $15,000, and the gravity component for a violation lasting two years is $25,000. Because the gravity component does not change in the size of the base fine, the marginal deterrence for a large violation will likely be very small. However, while this could drive very high penalty-to-benefit ratios for small violations, it would not directly contribute to the low ratios for large violations. For example, suppose that the economic benefit component is $1,000 and the gravity component is $10,000, and therefore a fine of $11,000 is imposed. The ratio of the penalty to the economic benefit would be $11,000/$1,000=11. However, suppose instead that the economic benefit component is $100,000 and the gravity component is $10,000, and therefore a fine of $110,000 is imposed. The ratio of the penalty to the economic benefit would be $110,000/$100,000=1.1. So while changes in the gravity component could contribute to high penalties, it should not contribute to excessively low penalties.
A final option is that the penalties are being set at a welfare-maximizing level. The fundamental insight of optimal deterrence theory is that the optimal fine is equal to the harm caused divided by the probability of detection.7878. Becker, supra note 12. With the fine set at this level, potential law-breakers will fully internalize the harmful externalities that they impose upon others, and will only engage in the harmful action if doing so is in society’s interest. The goal, therefore, is not to eliminate lawbreaking, but only to eliminate welfare-decreasing lawbreaking.
However, the EPA penalty policy is not set up in Becker’s framework.7979. Id. Instead, the explicit goal of the policy is to “remove any significant economic benefits resulting from failure to comply with the law.”8080. See generally U.S. Env’t Prot. Agency, supra note 2. This is instead a framework of total deterrence: the government wants people to comply with the law. Such a policy of total deterrence may be preferable in cases where there is uncertainty or ambiguity about the social costs of harmful emissions. Finally, the hypothesis that the low fines are social welfare maximizing strains credulity even using conservative estimates about the social costs of pollution. Following an enforcement action, the social benefits of the reduction in emissions are substantial. Given that the maximum fine imposed on any firm was $24 million, the level of fines are unlikely to be social welfare maximizing.
Overall, firms that profited from violations emitted large amounts of illegal pollution. And through enforcement actions, the EPA substantially reduced harmful emissions. The EPA should be applauded for this. However, while the emissions reductions are commendable, the low fines imposed give firms little incentives to comply with the law ex ante. Higher fines that induce firms to comply with the law could result in substantially larger reductions in harmful emissions.
Conclusion
Environmental preservation and pollution control are among the most important issues of the 21st century. If society is to cope with the challenges of climate change, it is imperative that the laws governing harmful emissions be effectively applied. In the absence of an effective regulatory state, profit-maximizing corporations can be expected to pollute and harm the environment when it is profitable to do so.
This paper provides evidence on the costs and benefits of noncompliance with environmental laws. I do so by using the methodology used by the EPA to reconstruct the economic benefit from noncompliance and matching this to the penalty that was actually imposed. While penalties for small violations are generally greater than the economic benefit of noncompliance, the benefits of noncompliance far outweigh penalties imposed for large violations. In aggregate, the penalties imposed are far lower than necessary to achieve the goal of removing the economic benefit of noncompliance. Penalties would need to be increased substantially in order to implement the stated goal that penalties should “at a minimum, remove any significant economic benefits resulting from noncompliance.”8181. U.S. Env’t Prot. Agency, supra note 3, at 4. As is, there are large economic benefits to firms from noncompliance with environmental laws. And to the extent that penalties remain low, we should expect firms to continue to pollute with relative impunity.
† Nathan Atkinson is an Assistant Professor at the University of Wisconsin Law School. The author wishes to thank Abhay Aneja, Eric Shaeffer, Alexander Stremitzer, Steph Tai, and seminar participants at the ETH Zurich, George Mason University, Northwestern Pritzker School of Law, Marquette School of Law, Oxford Faculty of Law, University of Western Ontario School of Law, and UC Berkeley College of Law for helpful comments and discussions. He also wishes to thank the editors at JREG for excellent work. Contact: natkinson@wisc.edu. This paper previously circulated under the title “Do Corporations Profit from Breaking the Law? Evidence from Environmental Violations.” Replication files are available at https://www.nathanatkinson.com.
