A Response to Brendan Carr and Nathan Simington on the Market Power of Social Media Platforms, by Sarah Oh Lam
In a recent article, FCC Commissioners Brendan Carr and Nathan Simington interpreted constitutional protections of Texas Law HB20. They describe social media platforms as “dominant” with “market power,” similar to the appellate courts and parties in the NetChoice cases.[1]
As economists, my colleagues and I filed an amicus brief in support of neither party in these cases to clarify these economic terms.[2] These terms have been asserted, yet the record includes minimal, if any, fact-finding or rigorous economic analysis to reach these conclusions.
Defining a market is a critical and controversial step in antitrust cases. Courts and economists consider geographic and product or service markets. A broader definition suggests a more competitive market, while a narrower definition that draws boundaries around a smaller set of firms shows less competition.
Defining digital markets isn’t easy. Often, consumers use the products or services without financial payments. Because the product of search, retail, or social media content is “free,” the typical antitrust tools of measuring cross-elasticity of demand and pricing are not directly applicable. This feature of digital platforms, however, does not mean that only one digital platform category exists, that each firm makes up its own market, or that we simply ignore the decades-long literature of what comprises markets.
Digital platforms compete for user attention and time, which is limited to only 24 hours per day per person, or perhaps slightly more through multi-tasking. Our research has focused on how different online activities substitute or complement each other. Empirically identifying substitutes and complements is a key part of evaluating competition.
As far as we know, no economic analysis has tested “dominance” or “market power” in social media platforms. “Market power,” in an economic sense, means that a firm has an ability to increase profits by charging prices above competitive levels.[3] “Concentration” in a market is yet a different concept that in and of itself does not measure competition either. Economics research has long since rejected the “structure conduct performance paradigm” (SCPP), which was an older form of analysis that concluded that market structure, rather than pricing elasticity, determined competition.[4]
Given this rejection of SCPP, antitrust agencies used concentration measures as screens to determine whether a proposed merger required further investigation. Based partly on that screen, agencies would use empirically rigorous tests to measure market power. Since prices do not exist in social media usage, agencies have not yet measured concentration levels as far as we know.
In our amicus brief, we estimate the concentration of social media markets with the Herfindahl-Hirschman Index (HHI) and inputs from recent industry reports. Since social media platforms do not have prices or quantities for users (revenues are generated in advertising), we looked at different inputs that could be used to calculate market concentration, such as time spent, number of users, and ad revenue.
Depending on the measure used in the analysis, the firms in the “social media” market will differ. We do not attempt to determine concentration or market power with these different HHIs. Instead, they show the challenges of describing a social media market and the need for care when using antitrust terms in legislative and judicial decisions.
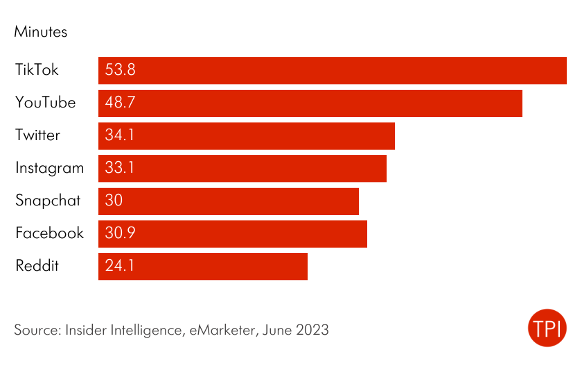
1. Time
If time spent on a platform is a proxy for value, then we can define market shares based on the time spent on each of the sites. The average time spent per day by U.S. users on select platforms from the seven top firms has a range of 24.1 minutes (Reddit) to 53.8 minutes per day (TikTok). We calculated a time-based HHI of 1536 from this data. Under the 2010 Horizontal Merger Guidelines and the 2023 Merger Guidelines, this would be considered “moderately concentrated.”[5]
2. Users
Monthly active users (“MAU”) could also be used to define market shares and concentration. Figure 2 shows user counts for Facebook, Discord, Instagram, TikTok, Snapchat, X (formerly Twitter), Pinterest, Reddit, NextDoor, and Threads.
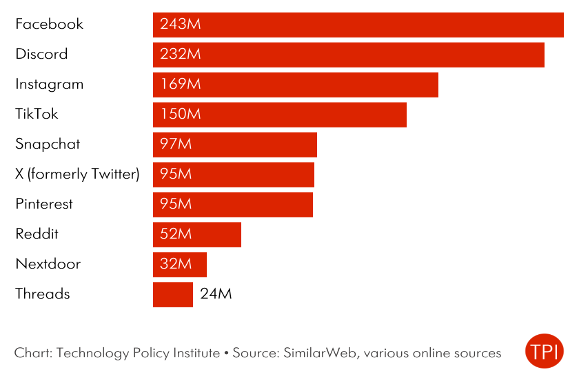
Using the seven firms as in the time-based HHI calculation, we calculate an MAU-based HHI to be 1733, signifying a “moderately concentrated” market under the 2010 and 2023 Guidelines.[6] A broader definition of social media that includes the ten competitors in Figure 2 would result in a lower MAU-based HHI of 1384, which would indicate an “unconcentrated” market under the 2010 Guidelines[7] and “moderately concentrated” under the 2023 Guidelines.[8]
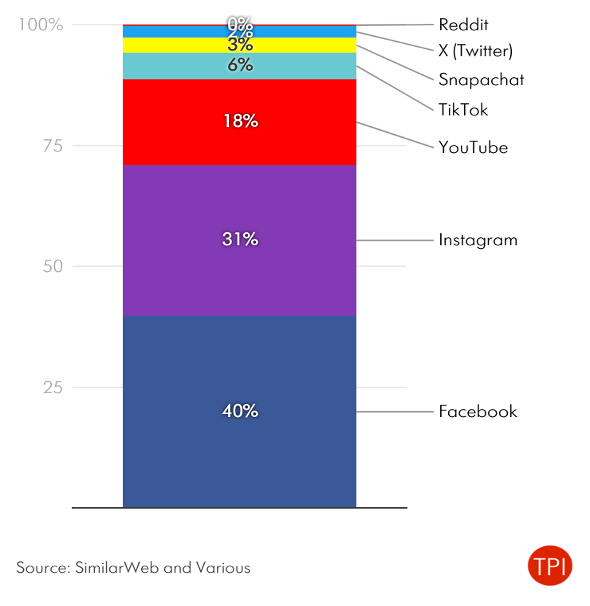
3. Revenues
Revenues may not be a particularly good measure of competition for users among social media platforms because revenues come from advertisers, not users. Revenue is worth analyzing, however, because it may be useful to size up advertising markets.
Figure 3 shows revenue shares of the seven social media sites identified in Figure 1. We calculate a revenue-based HHI based on these firms to be above 2900, which is higher than the 2500 threshold for antitrust authorities’ definition of “highly concentrated” under the 2010 and 2023 Guidelines.
Including these seven sites in an analysis of HHI would mean we define the market as a “advertising on social media platforms.” Arguably, however, advertising on traditional non-digital outlets should be included in the analysis as well. Social media platforms are part of a broader digital advertising market. Figure 4 shows the approximate shares of digital advertising sold by Google, Meta, Amazon, Snapchat, Microsoft, TikTok, Reddit, and other sites.
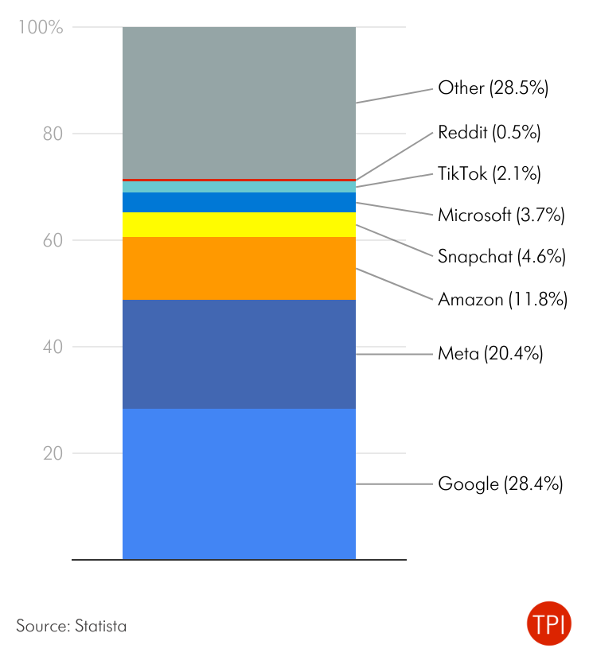
With these digital platforms, in addition to social media platforms, we estimate a revenue-based HHI of 2213 which is still within the “moderately concentrated” classification under the 2010 Guidelines and “highly concentrated” in the 2023 Guidelines.[9] This number gets smaller when we include traditional advertising (e.g., radio, television, and print) in addition to digital-only advertising.
4. Entry
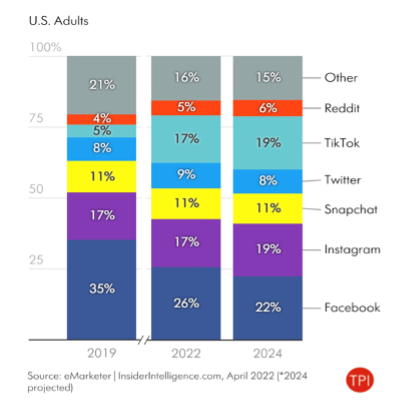
In our amicus brief, we also offer data on new entry in social media markets. These statistics tell us that the social media platform market is dynamic and rapidly changing. Any analysis of market power should take trends and rates of change into account. Figure 5 shows the share of time spent on select social platforms by U.S. adults with less concentration and more competition from new entrants such as TikTok.
When describing social media platforms as “dominant” with “market power,” it’s important for economists, lawyers, judges, courts, and legislatures to use these terms carefully and characterize firms based on evidence and data. If common carrier regulation is justified by a theory of market power and concentration, then economic facts should be part of the record.
Sarah Oh Lam is a Senior Fellow at the Technology Policy Institute. She was one of three Ph.D. economists who filed an amicus brief in support of neither party in both NetChoice cases.
[1] Moody, et al., v. NetChoice, LLC, NetChoice, LLC, et al., v. Paxton, Nos. 22-277 and 22-555, https://www.supremecourt.gov/docket/docketfiles/html/public/22-277.html.
[2] Brief of Economists as Amici Curiae in Support of Neither Party, Moody, et al., v. NetChoice, LLC, NetChoice, LLC, et al., v. Paxton, Nos. 22-277 and 22-555, https://www.supremecourt.gov/DocketPDF/22/22-277/292581/20231207114728510_231205a AC Brief for efiling.pdf.
[3] Thomas G. Krattenmaker, et al., Monopoly Power and Market Power in Antitrust Law, 76 Geo. L.J. 241, 242 n.5 (1987), https://www.justice.gov/atr/monopoly-power-and-market-power-antitrust-law (posted by U.S. Department of Justice).
[4] Timothy Bresnahan, Empirical Studies of Industries with Market Power, 2 Handbook of Industrial Organization 1011–57 (1989).
[5] 2023 Merger Guidelines, at 6, n.15, https://www.ftc.gov/system/files/ftc_gov/pdf/2023_merger_guidelines_final_12.18.2023.pdf (reverting to the 1982 thresholds that below 1000 HHI is “unconcentrated,” between 1000 and 1800 as “moderately concentrated,” and “highly concentrated” as above 1800) [hereinafter “2023 Guidelines”]; 2010 Horizontal Merger Guidelines, at 19, https://www.justice.gov/sites/default/files/atr/legacy/2010/08/19/hmg-2010.pdf (below 1500 HHI is “unconcentrated,” between 1500 and 2500 is “moderately concentrated,” and above 2500 is “highly concentrated.”) [hereinafter “2010 Guidelines”].
[6] Id.
[7] Id.
[8] Id.
[9] Id.
