D.C. Circuit Review – Reviewed: Show, Not Tell
Judge Douglas Ginsburg is a formidable jurist. When he speaks, we’d all do well to listen.
A few weeks ago, I heard Judge Ginsburg give a presentation to lawyers. He was asked what lawyers can do to improve their advocacy. His response surprised me. Mentioning Edward Tufte’s The Visual Display of Quantitative Information by name, Ginsburg urged lawyers to use charts more often and more effectively.
I confess: I had never heard of The Visual Display of Quantitative Information. So when I returned to my law school, I asked the library for a copy and have spent some time reviewing it. Judge Ginsburg is right. It’s very much a worthwhile book. To give you a small taste, here are a few examples (of many) that made me smile and that help illustrate why this book is so worthwhile:
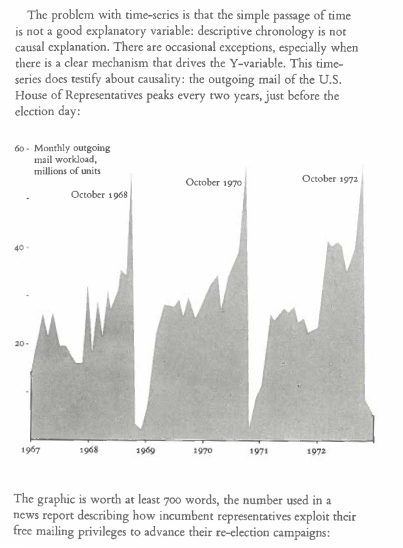
***
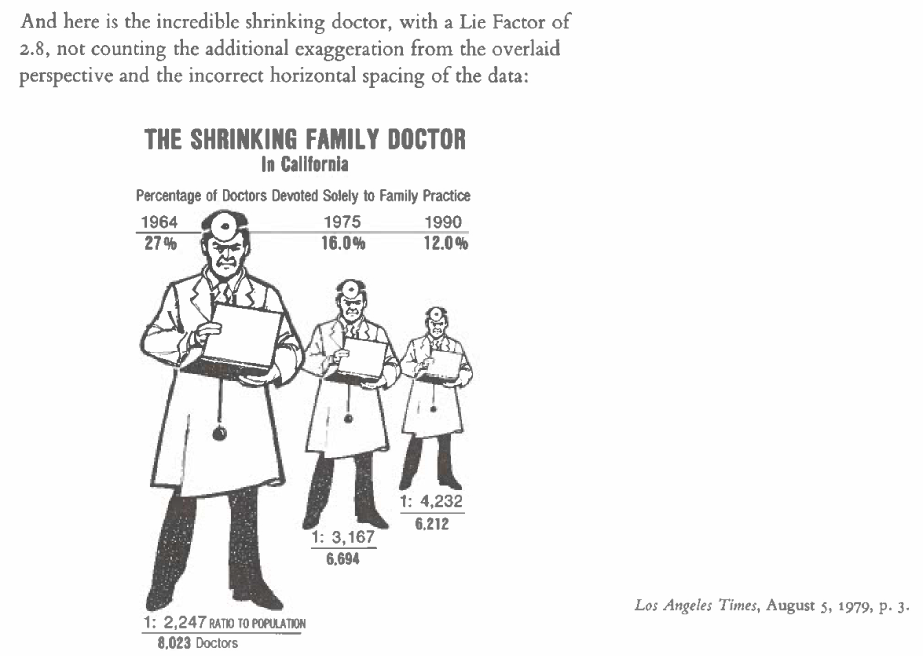
***
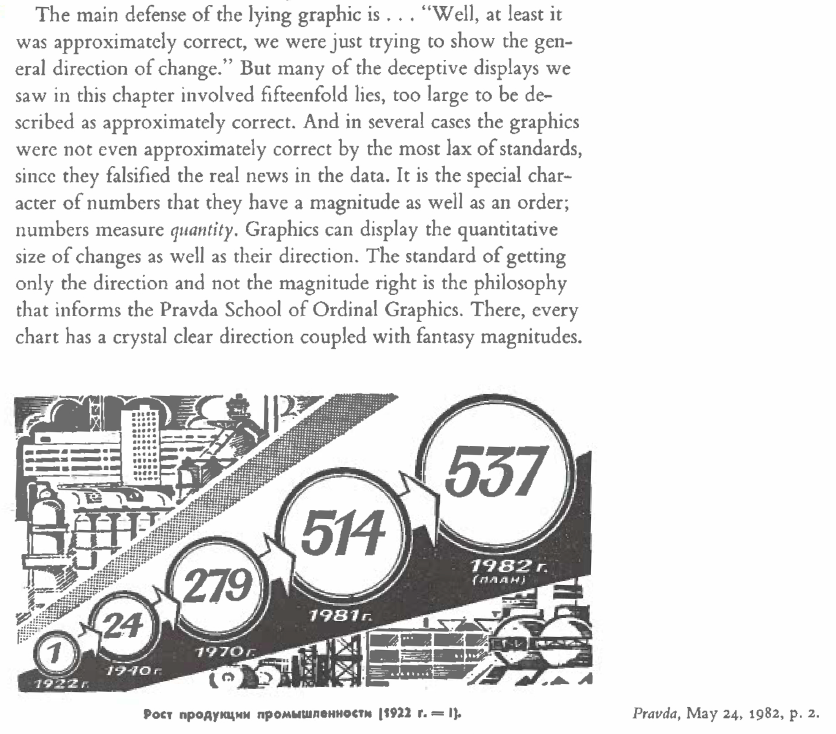
***
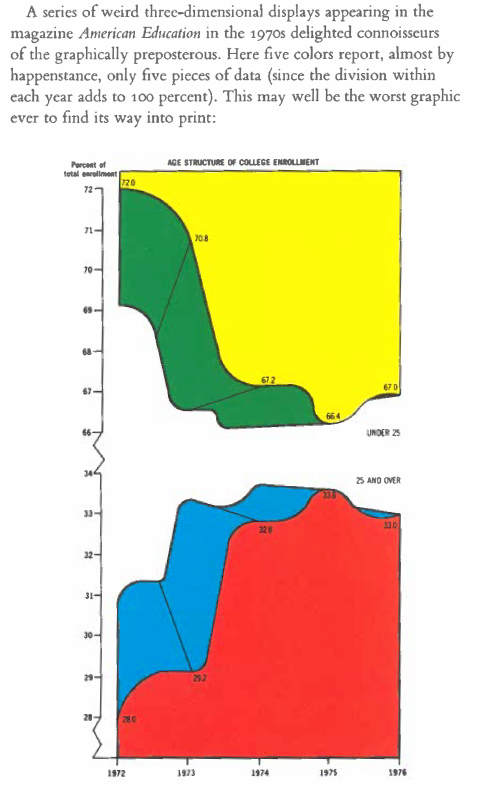
There are many more great examples in the book, as well as excellent commentary and advice. So buy it! Judge Ginsburg knows what he’s talking about.
This week, the D.C. Circuit decided just one case, and it is of fairly limited relevance outside of the D.C. area.* So with the help of the good folks in the BYU Law Library I’ve decided to do a deep dive into Judge Ginsburg’s own use of graphical displays. To be clear, I do not claim to have a complete list — this is a difficult search — but here are some examples.
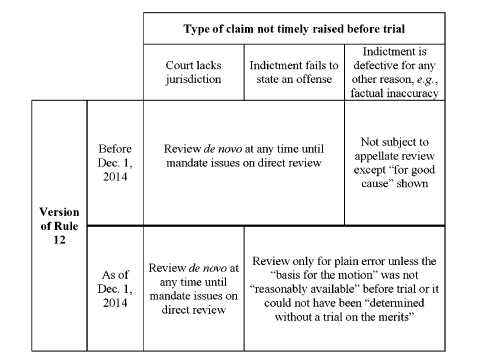
Consider United States v. Sperrazza from 2015 (Judge Ginsburg was sitting by designation in the Eleventh Circuit). Ginsburg wanted to explain how a federal rule had changed over time. He used this chart:
More exotically, consider this chart from Blue Man Vegas, LLC v. NLRB (2008):
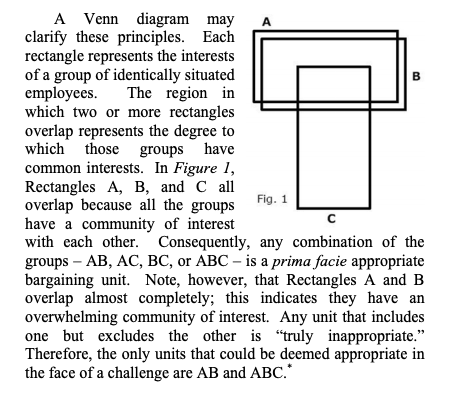
(There is another chart in the opinion, so give Blue Man a read.)
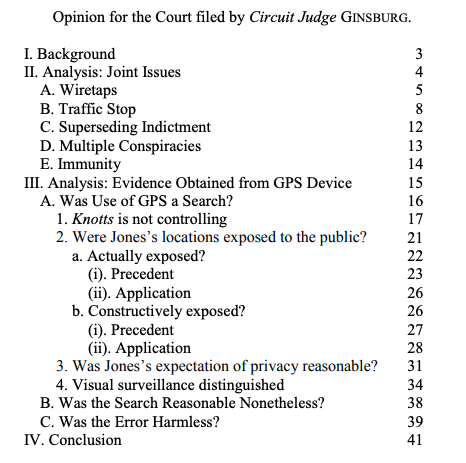
Here’s Judge Ginsburg’s handiwork in United States v. Maynard (from 2010). He began with a table of contents, which I think more judges should consider, especially for long opinions:
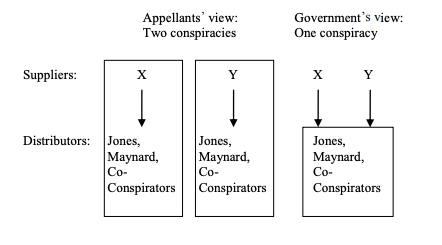
And then he added this chart, which may be confusing in the abstract but is less so in context:
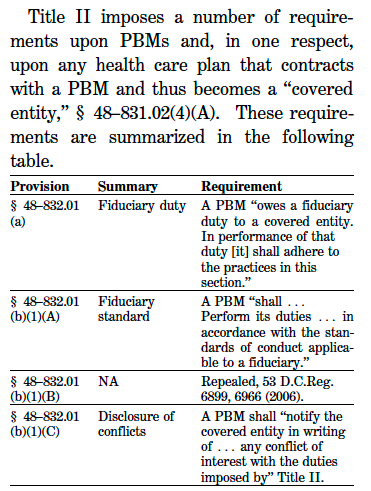
In Pharmaceutical Care Management v. District of Columbia (2010), Judge Ginsburg included the following table (this is a snippet):
He used a similar chart in 2002 in a case called Lozowski v. Mineta to explain a discrimination claim:
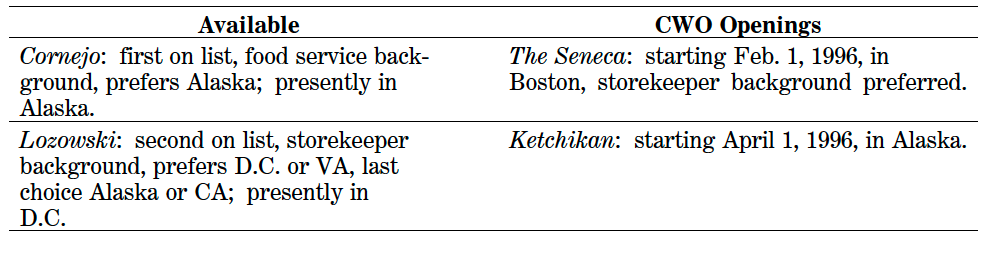
(He used the same type of table in 2010, in a case called Armstrong v. Geithner.)
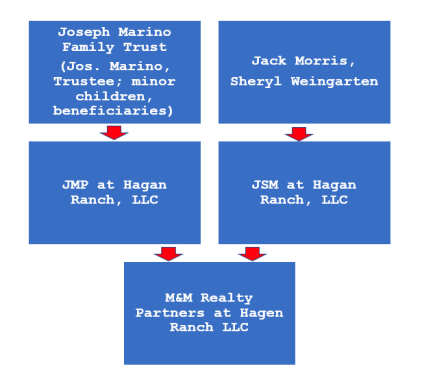
Again sitting by designation in the Eleventh Circuit, Judge Ginsburg recently included the following chart in M & M Realty Partners at Hagen Ranch, LLC v. Mazzoni (2020) to explain the relationship between various entities:
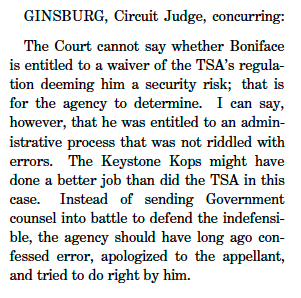
Finally, I also enjoyed these charts from Boniface v. Department of Homeland Security (2010):
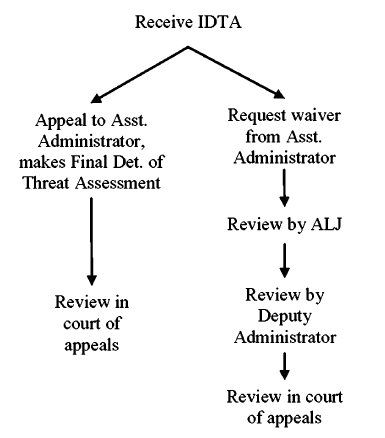
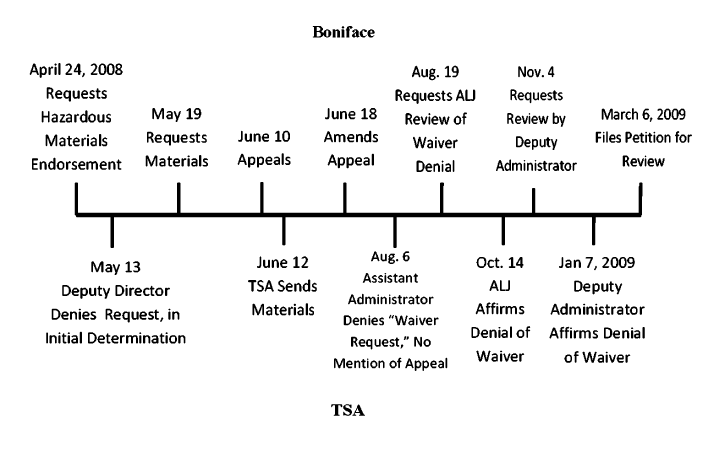
That said, I won’t say what Boniface is about or why Judge Ginsburg included these charts — you should read the opinion yourself. But I will offer this hint:
And with that, enjoy the weekend.
* The D.C. Circuit decided one case this week: Schindler Elevator Corporation v. WMATA. Judge Henderson (joined by Judges Jackson and Sentelle) addressed an unusual question, viz., whether the Washington Metropolitan Area Transit Authority can be sued for (allegedly) arbitrarily excluding a would-be supplier from a Request-for-Proposal process involving escalators. The case is interesting because it addresses sovereign immunity and whether the APA or some other legal instrument waives it for WMATA. The Court held that there was no waiver: “We must therefore answer the question whether WMATA is a federal agency under the APA. Our court has been less than clear on this issue but we hold today that WMATA, as an interstate compact entity, is not a federal agency within the scope of the APA.”
As I think about it, though, I wonder if there any charts about WMATA’s escalators ….
D.C. Circuit Review – Reviewed is designed to help you keep track of the nation’s “second most important court” in just five minutes a week.
